Author: Andreas Eberhard-Ruiz, Jobs Group, World Bank.
Out of 48 countries whose per capita income more than doubled in real terms since 1991, 47 experienced a decline in the share of workers in the agriculture sector, and in 27 of them, this decline exceeded ten percentage points. However, the sectoral shift in employment is not always into waged work, as we observed in blog #1 of this series, where we contrasted growth and jobs outcomes in Vietnam with Zambia. A key question is: Which sectoral shifts lead to more waged employment?
To answer this question, we study employment changes over five-year intervals for 104 Lower- and Lower Middle-Income Countries (LICs and LMICs) for which we have data between 1991 and 2016, in a multiple regression framework, with country fixed effects and controls for per capita income growth, initial sector shares, and initial waged share of employment. We find that countries create more wage-paying employment in periods during which people move from agriculture into industry than in periods during which people move from agriculture into services.
Chart 1 illustrates the approach with a hypothetical example. Assume that in 1991, there were two identical Countries A and B, both with the same sectoral distribution of employment across sectors. Assume also that as A and B developed between 1991 and 2018, they both had a 20-percentage point decline in the share of people working in agriculture. But, assume that workers in A moved into industry, whereas in B, they moved into services. Our regression analysis suggests that by 2018, the waged to non-waged employment ratio would have risen by twice as much in Country A as in Country B.
Chart 1: A comparison of predicted changes in the waged to non-waged employment ratio on the account of different sectoral employment shifts
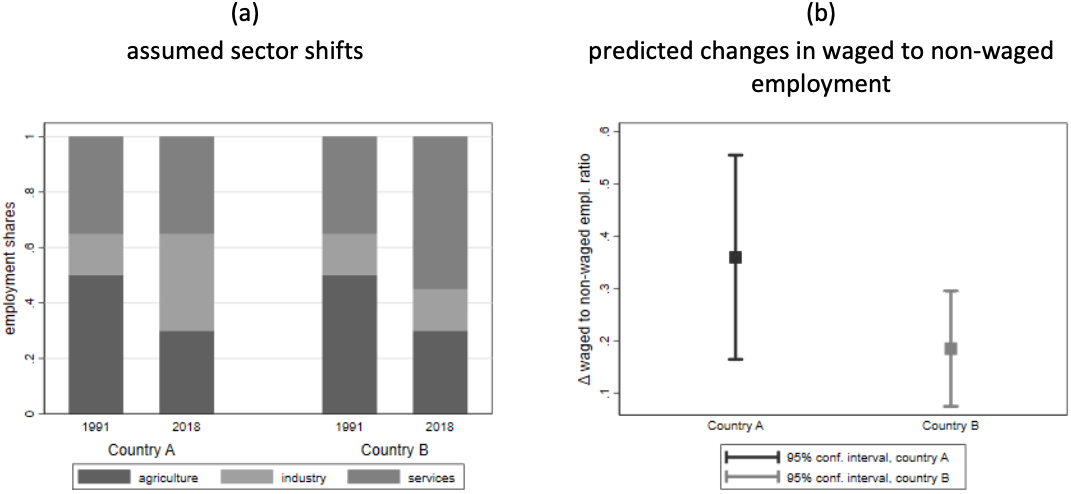
Notes: Panel (a) assumes a hypothetical shift in employment across sectors for two different countries. Panel (b) reports the predicted effects of these shifts on the waged to non-waged employment ratio. Results are based on a regression analysis examining changes in the waged to non-waged employment ratio using data for 104 LICs and LMICs over five-year intervals between 1991 and 2016 with country-fixed effects and controls for per capita GDP growth, initial sector employment shares, initial waged to non-wage employment ratio.
To identify differences in average waged job creation as labor moved into industry and services, we plot the changes in the ratio of waged to non-waged employment, against changes in sector employment shares for each growth period in our data (chart 2). Panel (a) shows the service sector and panel (b) shows industry. The areas circled in red show periods for which the share of employment in the sector grew, but the share of waged jobs in total employment fell. There are more instances in services than in industry of periods for which an increase in the share of workers coincides with a decline in the ratio of waged to self-employment. We saw in blog #2 that when workers leave agriculture, they tend to find jobs in services. For LICs and LMICs, this result tells us that this type of structural change is quite often accompanied by a decline in the share of waged jobs.
Chart 2: Change in the waged to non-waged employment ratio vis-à-vis changes in the share of worker employed in services and industry
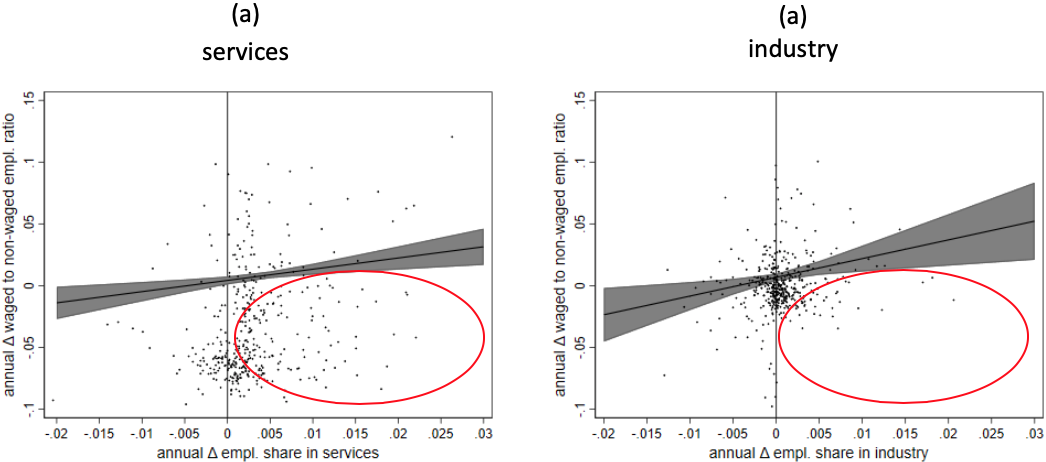
Notes: The upward sloping lines in each chart correspond to the predicted relationship between the change in the waged to non-waged employment ratio and the change in the respective employment shares following our regression model of chart 1, with a 95% confidence intervals caputred by the grey shaded area. The scatter points plot partial residuals of the annual change in the waged to non-waged employment (i.e. the scatter points are plotted absorbing the variation coming from fixed effects and regression controls) on the respective change in sectoral employment shares.
Comparing the upper right quadrant of chart 2(a) – where the share of waged employment rose as labor moved into services – with the lower right quadrant is interesting. The only apparent difference in observations of country-periods is that sub-Saharan African countries are much more likely to be in the lower than in the upper quadrant.
This supports an often-held view that growth in sub-Saharan Africa over the last two decades has not come from industrialization with waged jobs, as was the case in East Asia. Instead, as recently put in an article by The Economist, the absence of more wage-paying jobs in many African countries has forced people to create their own jobs. Hence, several sub-Saharan African countries have come out at the top of global entrepreneurship rankings. Much of this entrepreneurial activity is in service activities, which do not require much start-up capital, are associated with high levels of failure, and do not typically lead to the hiring of additional waged employees.
In assessing whether structural change is successful in transforming people’s lives and generating better jobs, an understanding of what happens to jobs and labor productivity in the services sectors is key. When do services merely absorb workers who cannot find good waged-paying opportunities off-farms, and when do they truly generating better-quality jobs that transform lives? Why is sub-Saharan Africa so different?
To address these questions, future blogs in this series will untangle key growth patterns across country types, and examine which types of activities within the services sector result in the creation of waged jobs, and which do not. We will keep you posted!