Authors: Dino Merotto and Andreas Eberhard-Ruiz, Jobs Group, World Bank.
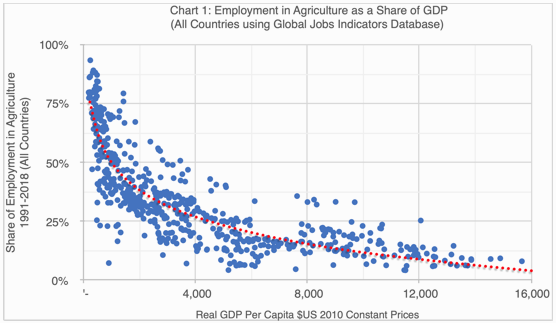
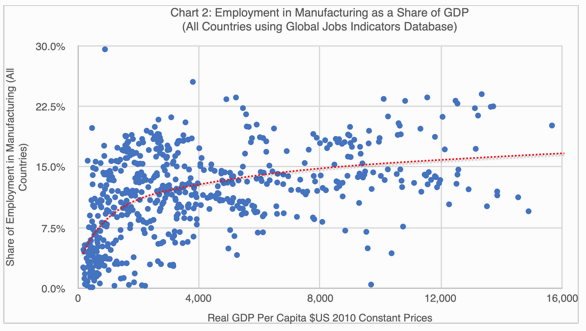
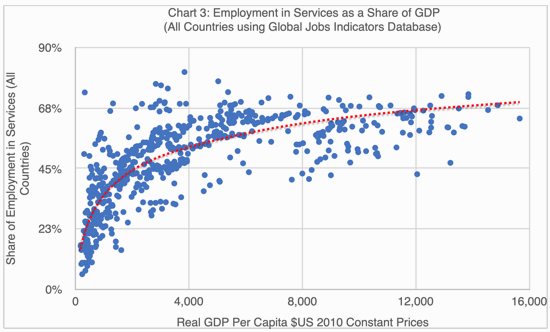
Data on employment shares by sector show the rising importance of service jobs as countries get richer – and a corresponding decline in the share of agriculture jobs. Manufacturing, in contrast, plays a much less important part in the shift to higher incomes and it rarely accounts for more than one-fifth of all jobs in an economy.
Structural transformation is about changes to the structure of consumption, production and employment. Studies of economic structure and employment date back to Clark (1940), Kuznets (1957), Chenery (1960) and Chenery and Syrquin (1975). Their central thesis, revisited by McMillan and Rodrik (2014), is that economic growth requires ‘structural change’, defined as a shift in resource allocation in the economy from primary to secondary and tertiary activities.
In this blog we look at the structure of employment in countries at different levels of per capita GDP. Kuznets noted that the pattern of structural change over time “is remarkably consistent” with the pattern found from using a cross-section of countries by GDP per capita. Here, we combine these approaches, by taking the per capita GDP in constant $US2010 and shares of employment by sector for 640 observations across 103 countries at all points in time where the World Bank has collected micro data between 1991 and the present.
The prediction of the structural change literature, that richer countries will have a lower share of employment in agriculture, is confirmed. But the spread of shares in agriculture varies a lot, as is shown in chart 1. For Low Income Countries (LICs), the average share of employment in agriculture was 63 percent, with a standard deviation of 16 percent. For Lower Middle Income Countries (LMICs), the average is 35.1 percent with a standard deviation of 11 percent.


The share of manufacturing jobs is also higher in richer countries. But it seldom exceeds 20 percent of total employment. The mean share of manufacturing employment for LICs observed in the micro datasets available to the World Bank is just 6.4 percent, with a standard deviation of 0.9, and the distribution is skewed below the mean. For LMICs, the average share of manufacturing in total employment is 12.2 percent with a standard deviation of 4.3. This finding is consistent with Kuznets’ study. Kuznets concluded that the share of the manufacturing sector “does not rise beyond a certain level.” He suggested this was “possibly because rapidly rising productivity per worker makes it unnecessary to divert into the manufacturing sector an increasing share of the labor force.” We explore that relationship in blog #5 in this series.
It follows that services must account for growing share of total employment as countries get richer. Chart 3 shows that this is true even in LICs and LMICs. In LICs, the average share of services is 28 percent of total employment with a high standard deviation of 13, and in LMICs, the average is 47 percent, with a standard deviation of 11.
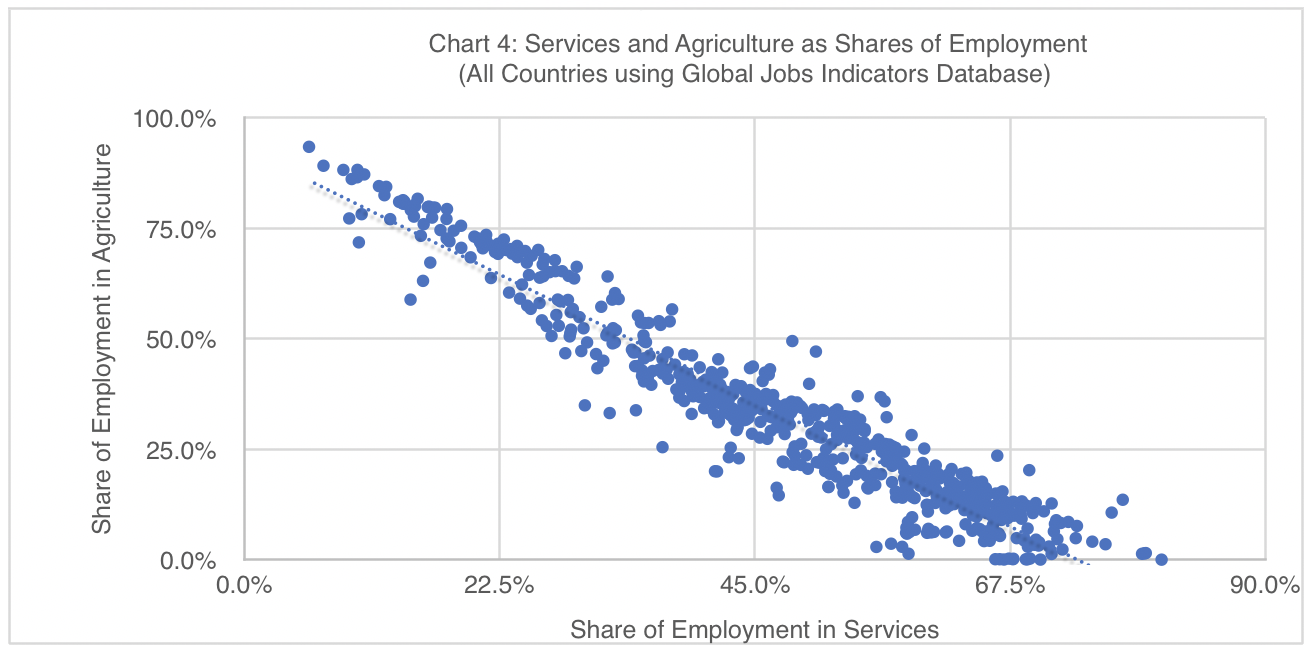
These findings imply that, when workers are not employed in agriculture, they tend to work in services. Chart 4 suggests this correlation is strong, yielding a correlation coefficient, r of 0.96.

These simple observations also imply the probability of an underlying causal relationship. In a subsequent blog, we look at episodes of growth and economic transformation to check if there is a link between growth in agricultural productivity and the rate of growth in service employment in low and lower middle-income countries. Then, we will follow Kuznets’ hunch and Baumol’s related theory of “cost disease” to explain why, in richer countries, so many people work in services.


