Author: Dino Merotto Jobs Group, World Bank
If you haven’t read Easterly and Levine’s “It’s Not Factor Accumulation” you should. But you should also read Klenow and Rodriguez-Clare’s “The Neoclassical Revival in Growth Economics: Has It Gone Too Far?”.
Since it was published in 2001, Easterly and Levine’s ideas have shaped much of World Bank thinking about growth policies, which have often stressed the importance of Total Factor Productivity (TFP), as represented by the constant term (A) in a standard Cobb Douglas Production function. At the same time, the Bank has down-played the importance for growth of accumulating more human or physical capital.
But when I consulted Bosworth and Collins’ “The Empirics of Growth: An Update” looking for numbers for Low-Income Countries (LICs) that would validate the thesis of “It’s Not Factor Accumulation”, I didn’t find them. That’s maybe because, in LICs, capital accumulation and TFP are inter-related. Capital investment both embodies technical change and makes labor more productive. Bosworth and Collins concluded that “both capital (physical and human) accumulation and improvements in economic efficiency are central to the growth process. For most purposes, the emphasis on determining which is most exogenous or most important seems misplaced”. My own simple growth accounting for the fastest growing economies from 1991-2017 concurs: capital accumulation explains 50% of real GDP growth, and TFP explains 35 percent.
This is not a new insight for LICs. In their classic study of “Patterns of Development (1950-1970),” which was published in the early 1970s, Chenery and Syrquin identified four growth processes in development:
- Changing patterns of demand with rising per capita income (whereby income elasticity drives market potential, see blog #8)
- Accumulation of physical and human capital at a rate exceeding the growth of the labor force
- Access to technology
- Access to international trade and capital inflows (covered in a future blog).
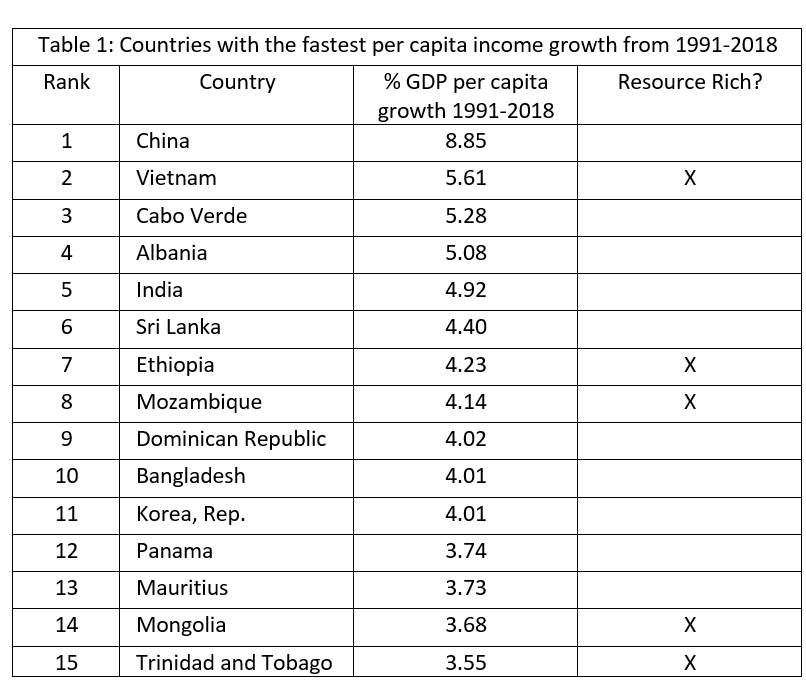
In this blog, I analyze LIC and LMIC countries with fast per capita GDP growth compared to regional averages over the last 30 years. The analysis covers 15 countries for which ample data is available for 1991-2017 (table 1). The first thing to note from table 1 is only 5 of the 15 fastest growing countries in per capita GDP terms are resource-rich (using the World Bank TCdata360 definition). The three countries most dependent on extractives – Trinidad and Tobago (over 50% of exports in oil), Mozambique (58 percent coal, petroleum, and metals) and Mongolia (70 percent mining and extractives) – each enjoyed booming exports during the period 1991-2017.
To uncover the drivers of per capita growth in the non-resource rich success stories, Chart 1 looks at changes in the structure of aggregate demand, using WDI data. In blog #8 we observed the importance of changing patterns of demand for structural change. Consistent with Chenery and Syrquin’s findings, we see here that increased investment (gross fixed capital formation) drove growth in the largest countries (China, India, and Bangladesh), and a combination of net trade and investment featured in the smaller countries. Only little Mauritius kicks the trend, reporting a strong rise in the share of final consumption and declining shares of investment and net trade.
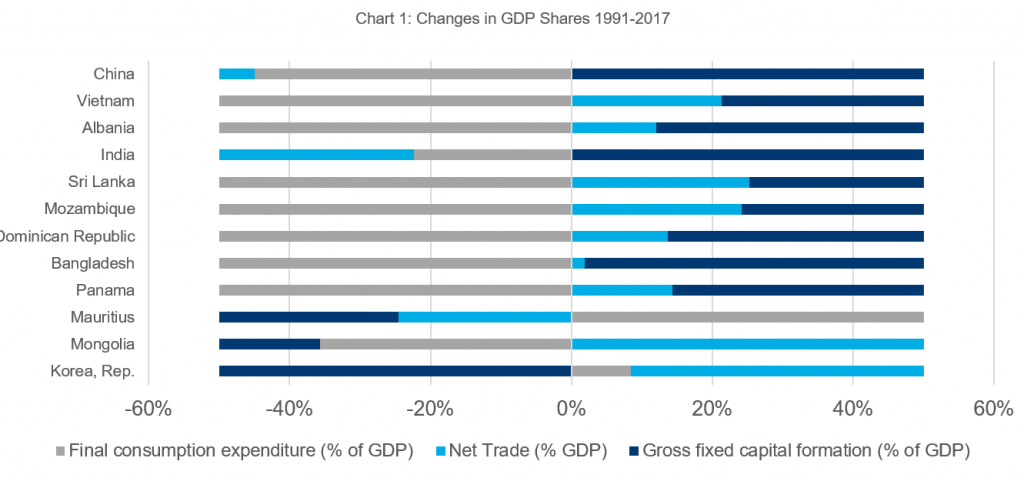
In India, the share of exports of goods and services in GDP rose from just 8.5 to 18.8 percent of GDP. In China, although exports were also rising significantly, the increase was from 14.5 to 20 percent of GDP, compared to an increase in investment as a share of GDP from 26 to 43 percent. In Bangladesh, exports rose from 6.7 to 16 percent of GDP, while investment rose from 17 percent of GDP to 31 percent. In all 3 of these countries, the rise in imports offset the rise in exports, and so in aggregate, foreign savings (the capital account or net transfers) were used to finance part of the increase in investment. On balance, since the change in net trade was negative, and (non-tradeable) services increased as a share of GDP, changes in production in these large countries (which together make up 37 percent of the world population) supplied rising (and changing patterns in) domestic demand. But through greater openness, each was able to raise productivity through policies that supported comparative advantage in trade, and each was able to access foreign capital to help finance export-oriented and growth-enhancing investments.
In the smaller countries – Vietnam, Sri Lanka, the Dominican Republic and Albania – investment and net exports drove growth. The Korean Republic is an outlier. There, according to WDI data, exports rose dramatically from 24 to 43 percent of GDP, consumption remained buoyant, but investment had peaked at a global high of one-third of GDP in 1991, and subsequently contracted to 27 percent by 2017.
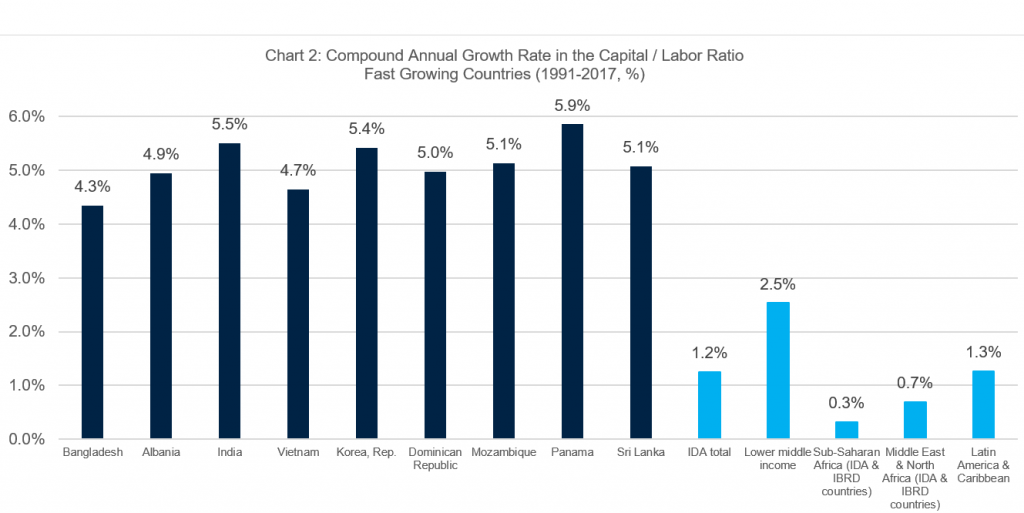
Without a doubt, an important dimension of success in the fast-growing countries was capital deepening – the augmentation of labor with capital. Chart 2 uses data from a World Bank growth accounting tool to estimate the compound annual growth rate of the capital per worker ratio for those fast-growing countries for which data is available for 1991-2017. The chart shows that annual growth in the capital/labor ratio in fast-growing countries was twice the average of lower-middle-income countries, over four times faster than the average for IDA countries, and almost 17 times that of the average for Sub-Saharan Africa (SSA), where, in some countries, youthfulness means the labor force (inexperienced, if more literate than their elders) labor force is growing at around 4 percent per year, and where most employment is in capital-thin `traditional sectors’.
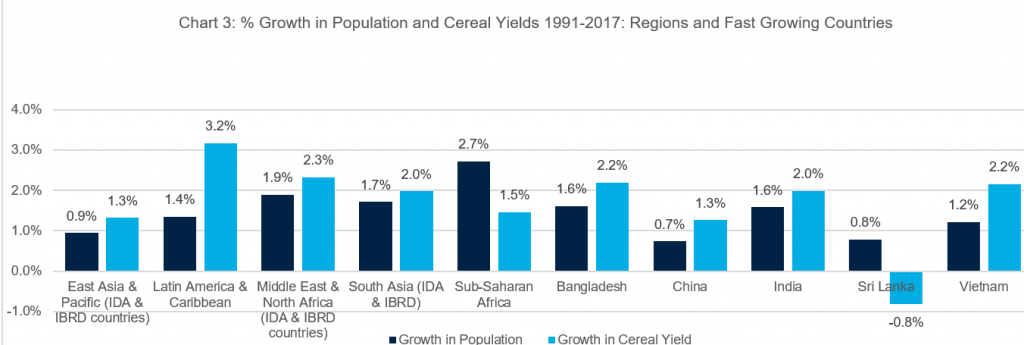
Technical change is harder to measure with country-level data. A crude indicator of whether it is happening in agriculture at a pace that exceeds the demand for food would be whether growth in cereal yields exceeds population growth. An indirect measure would be whether the price of food is rising more slowly than the price of non-food items – we will cover this in a future blog for 2005-2017 using new ICP data.
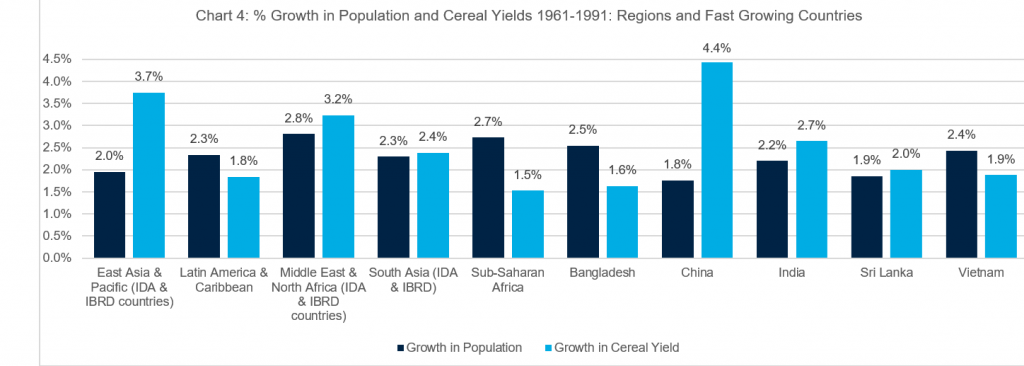
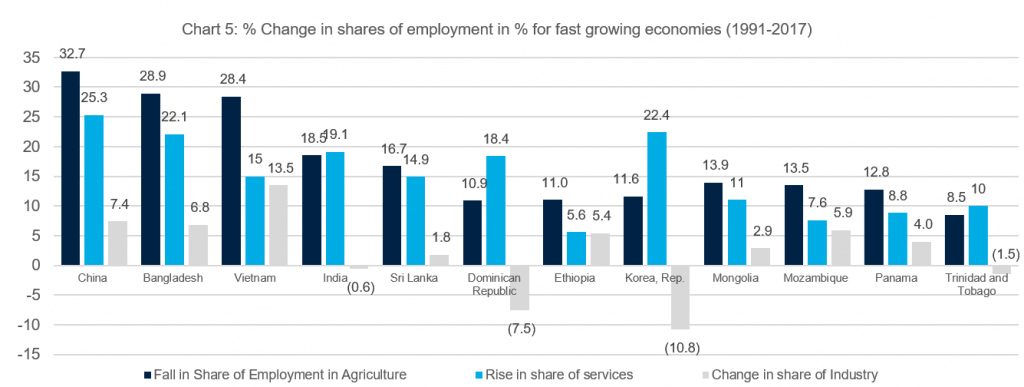
The proportion of workers required in agriculture, then, depends on whether the demand for food per head is increasing faster or more slowly than agricultural productivity. Charts 3 and 4 show the rates of growth of cereal yields and population for fast-growing countries and regions over the periods 1991-2017 and 1961-1991 respectively. In each of the fastest-growing countries, except for Sri Lanka, growth in cereal productivity since 1991 exceeded population growth. In contrast, for slow-growing sub-Saharan Africa, population growth exceeded growth in cereals. China stands out. Both in the period 1991-2017 and in the preceding three decades from 1961-1991, growth in cereals yields was almost twice the population growth rate. As chart 5 shows, this allowed a dramatic shift of about one-third of Chinese workers out of agriculture. The urban share of China’s population increased from 27.3 percent in 1991 to 58 percent in 2017. For the Dominican Republic and Albania, the urban shares of the population rose by 25 and 23 percentage points respectively. For Bangladesh and Vietnam, it increased by 15.6 and 14.6 percentage points respectively.
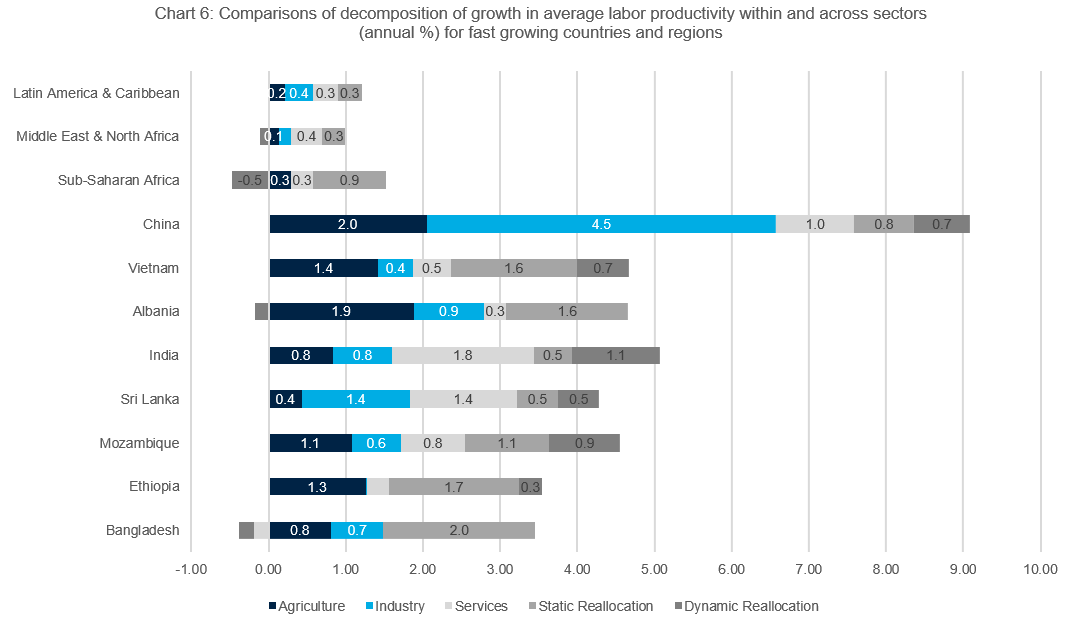
These results for faster-growing economies suggest that the following are important to achieve growth in labor productivity in LICs:
- structural change (the movement of labor out of agriculture);
- capital deepening (the augmentation of labor with machinery and equipment);
- technical change (demonstrated in this case through agriculture);
- productivity growth in the tradeable sectors (proxied here by real GDP per worker in agriculture and industry).
A country’s per capita income and its endowments of human and physical capital determine which of these processes to support policy reforms and investment for better jobs. We shouldn’t conclude in LICs that it’s not factor accumulation.


